Working Life
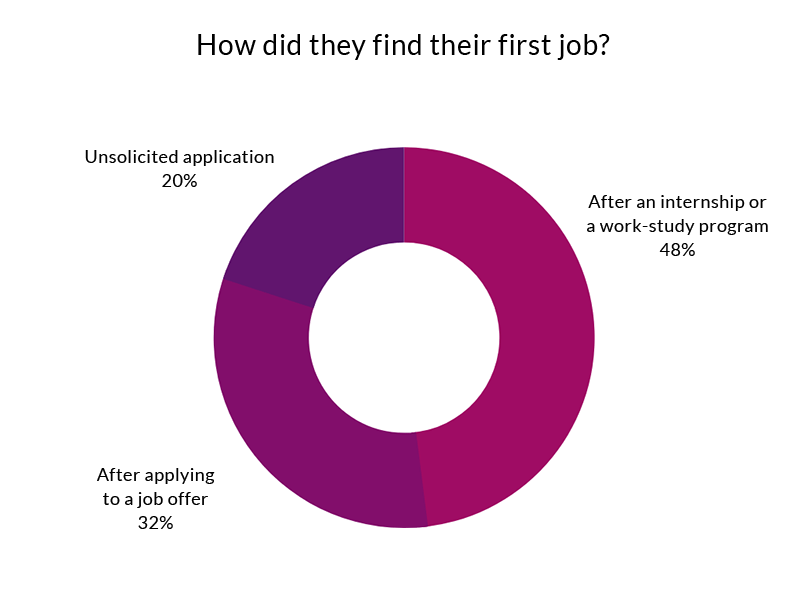
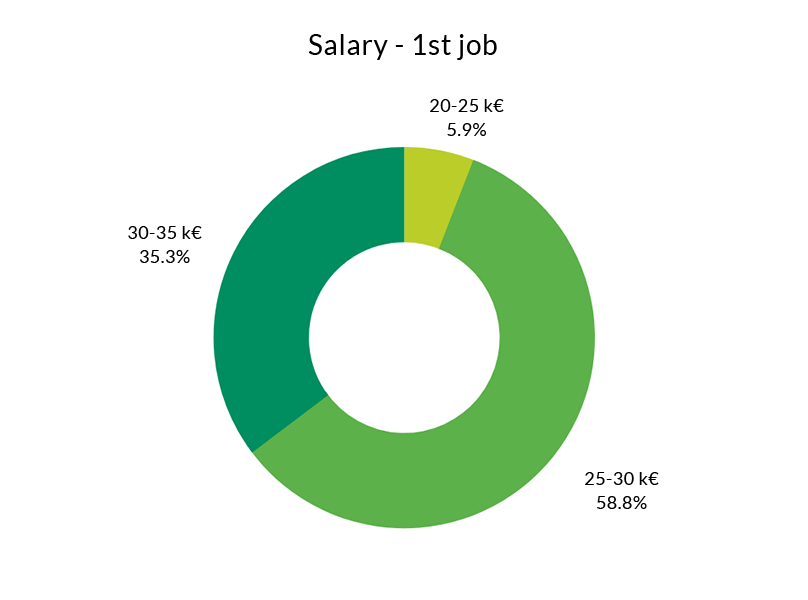
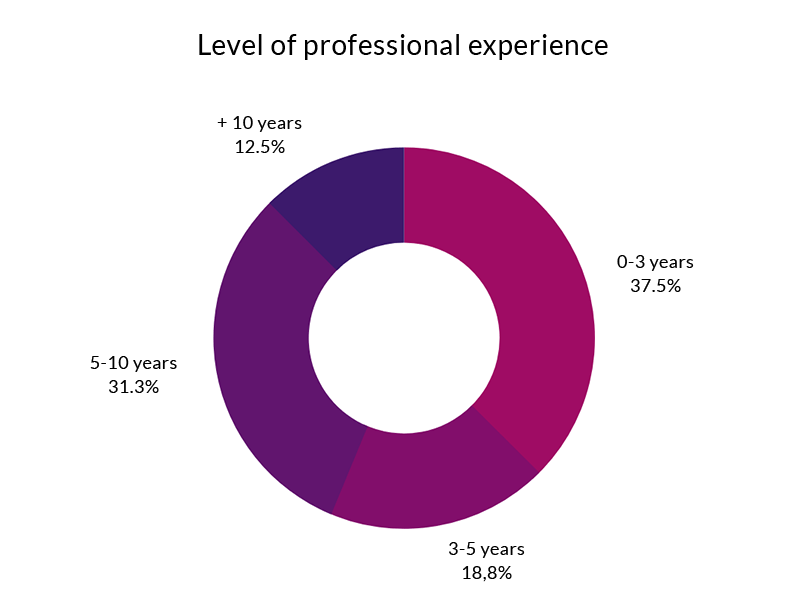
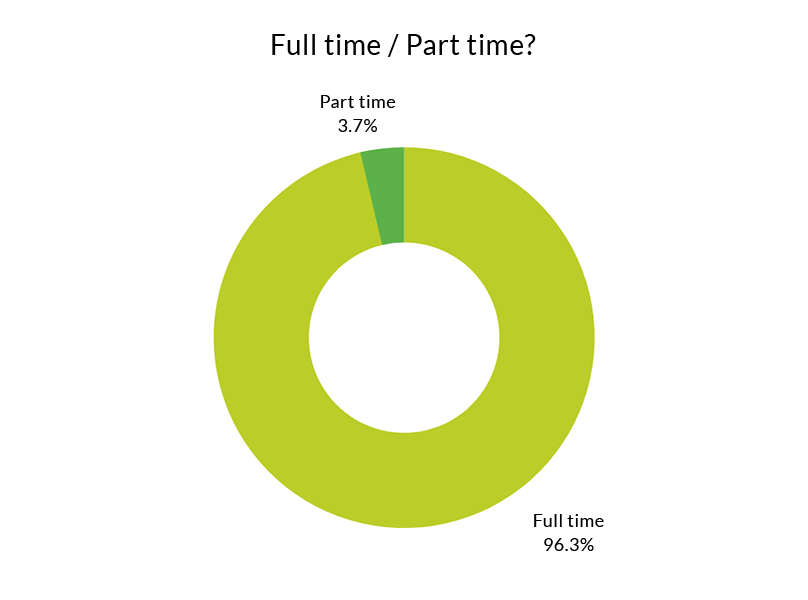
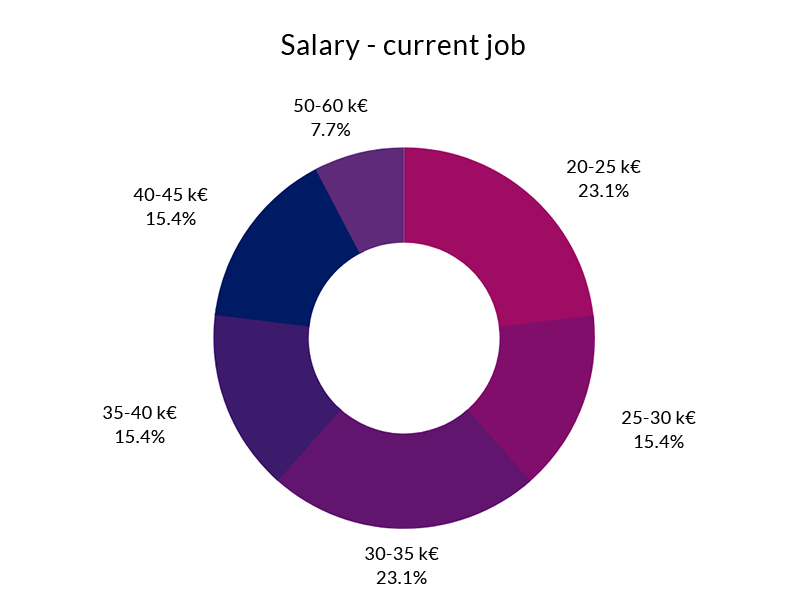
What do our students do after graduating?
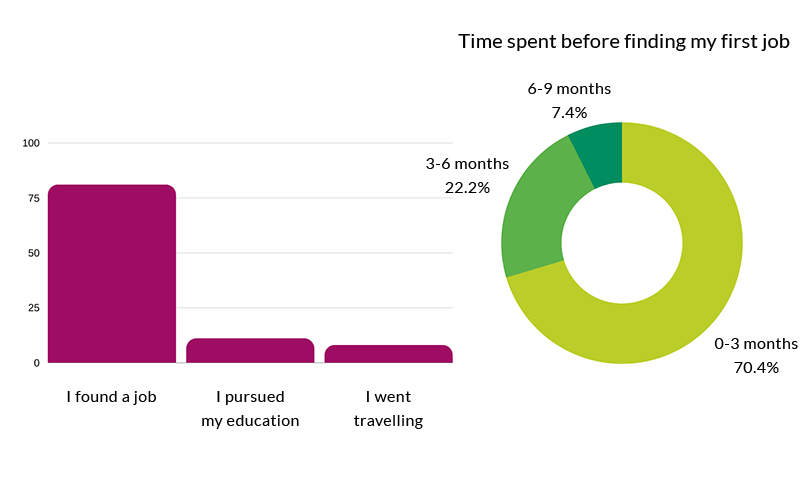
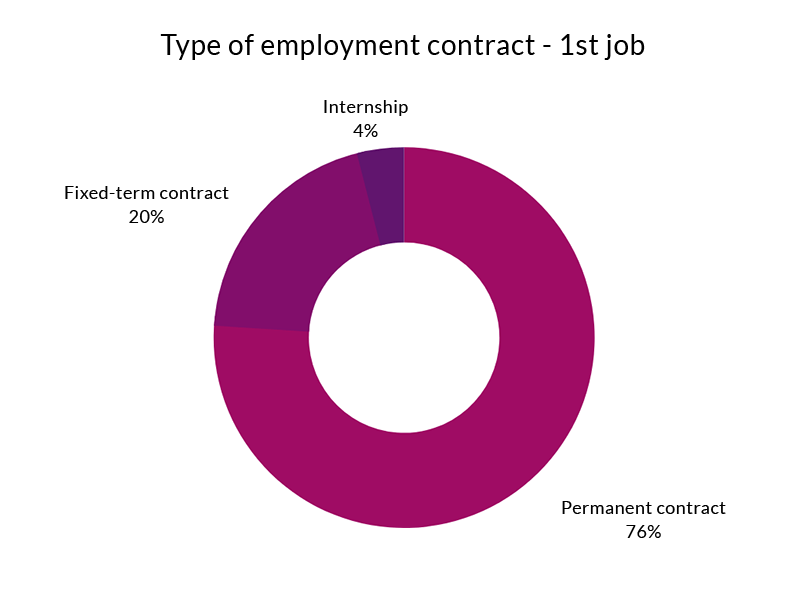
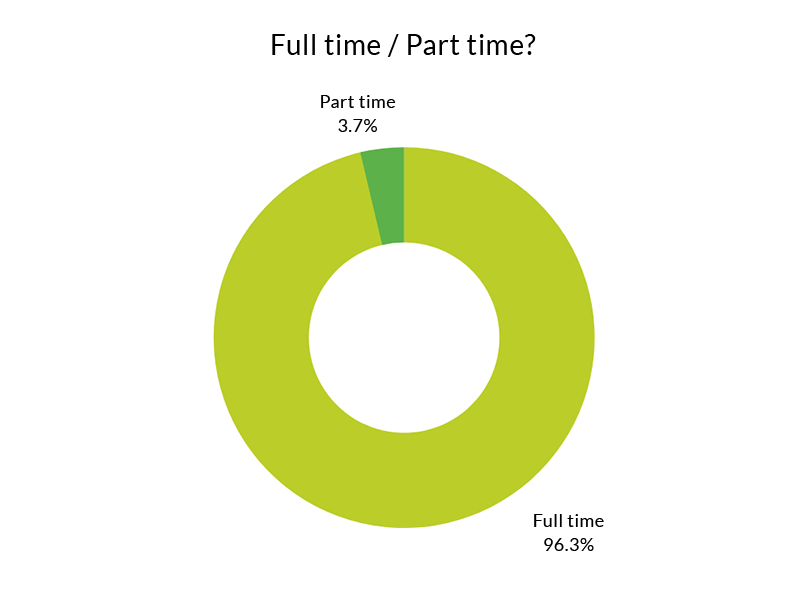
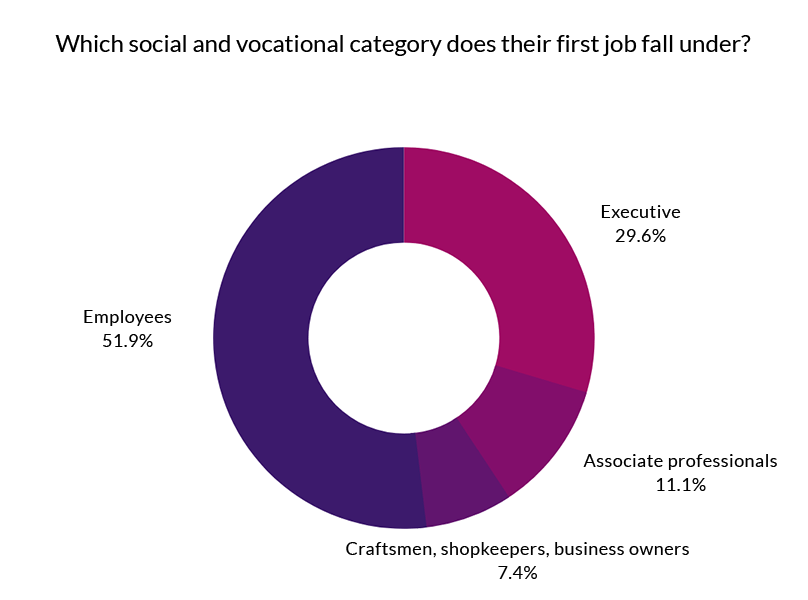
What kind of job did they get?
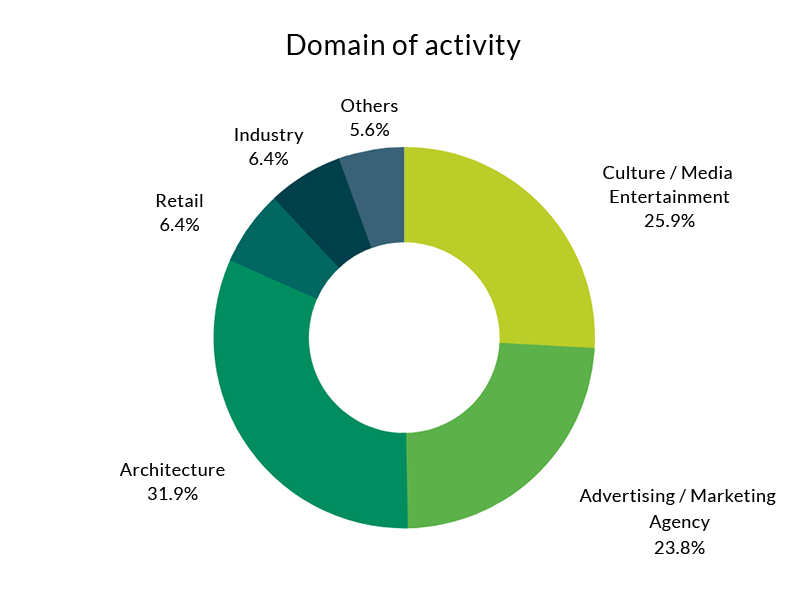
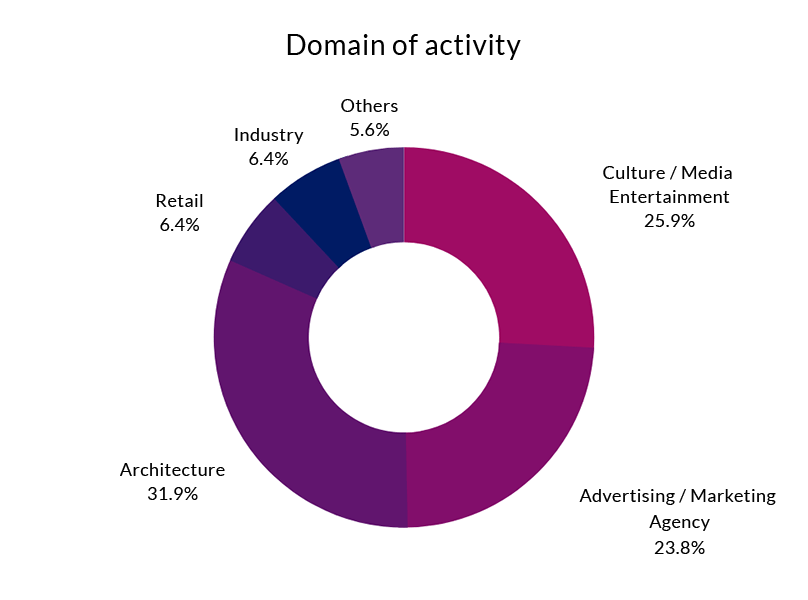
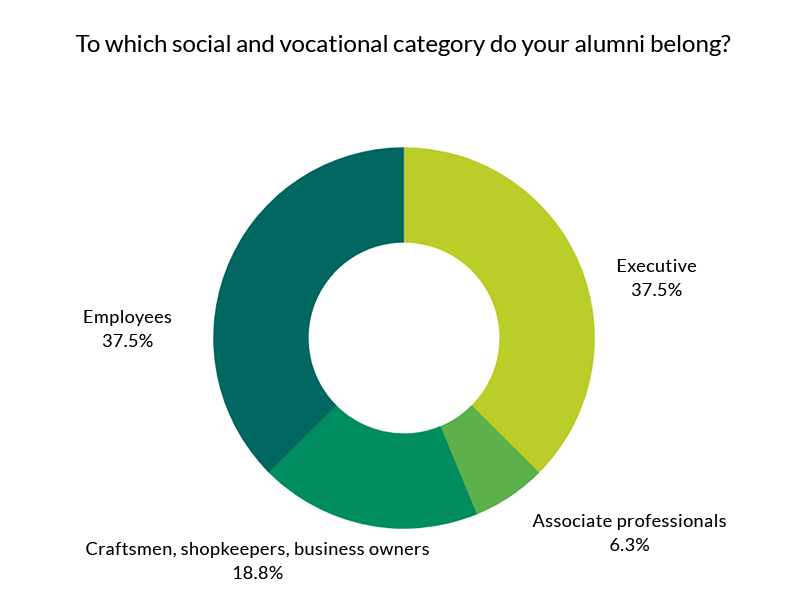
Our students' working life: where do they work today?
Employment figures for our RNCP certified courses
Art Director in Graphic Design
| Certification year | Number of Certified Students | Number of Certified Students following an APEL procedure | Employment Rate 6 Months After Graduation (in %) | Employment Rate in the Occupation of Choice 6 months after Graduation (in %) |
| 2019 | 26 | 2 | 100% | 92% |
| 2018 | 16 | - | 100% | 100% |
| 2017 | 13 | - | 80% | 77% |
Interior Design Architect
| Certification year | Number of Certified Students | Number of Certified Students following an APEL procedure | Employment Rate 6 Months After Graduation (in %) | Employment Rate in the Occupation of Choice 6 months after Graduation (in %) |
| 2019 | 10 | 1 | 90% | 80% |
| 2018 | 25 | - | 92% | 84% |
| 2017 | 09 | - | 80% | 77% |
Sustainable Designer
| Certification year | Number of Certified Students | Number of Certified Students following an APEL procedure | Employment Rate 6 Months After Graduation (in %) | Employment Rate in the Occupation of Choice 6 months after Graduation (in %) |
| 2019 | 16 | _ | 100% | 90% |
| 2018 | 11 | - | 100% | 100% |
| 2017 | 12 | - | 83% | 75% |
| 2016 | 13 | - | 85% | 31% |


